Optical Dating of Quartz Grains From the Minjiang Fluvial Terraces in the Sonpan Area on the Eastern Margin of the Tibetan Plateau
 Ye-Song Han,
  Jia-Fu Zhang
 Geng-Nian Liu
- MOE Laboratory for Earth Surface Processes, Department of Geography, College of Urban and Environmental Sciences, Peking University, Beijing, China
The fluvial terraces along the banks of the Minjiang River are very important for understanding the tectonic activities of the eastern margin of the Tibetan Plateau and have been widely investigated. However, the reliability of the ages previously reported for the terraces needs further evaluation. In this study, the Minjiang River terraces in the Sonpan area from Hongqiaoguan to the Songpan town were investigated and dated using optically stimulated luminescence (OSL) techniques on quartz grains. Seven strath terraces (T1–T7) were recognized based on the exposures of fluvial sediment and the elevation of bedrock strath, and two of them have been reported by previous studies. The terrace deposits and overlying loess were sampled for OSL dating. The samples exhibited a large scatter in De, even for loess samples, which could be attributed to poor bleaching at deposition. However, the OSL ages obtained using the minimum age model were underestimated, and those obtained using the central age model are considered relatively reliable based on stratigraphic and geomorphological consistency and the comparison of the ages between stratigraphically parallel samples. The results show that the loess samples overlying fluvial terrace sediments were deposited later than terrace formation and their OSL ages cannot represent the terrace formation ages. The T1, T3, T4, T5, and T6 terraces were dated to 13.5 ± 0.6, 29.0 ± 1.7, 48.0 ± 3.3, 44.3 ± 5.2 and 63.8 ± 4.7 ka, respectively. The T4 and T5 terraces may be the same terrace with a weighted mean age of 46.9 ± 2.8 ka. The ages of the T2 and T7 terraces were inferred to be ∼20 and ∼80 ka, respectively, based on the relationship between strath ages and elevations of the other terraces. The mean bedrock river incision rates were calculated to be 1.2 ± 0.1 mm/a for the time period of 64 ka for the T6 terrace—14 ka for the T1 terrace, and 0.15 mm/a for the past 14 ka.
1 Introduction
The eastern margin of the Tibetan Plateau has been an active tectonic zone, where tectonic movements such as fault activities and earthquakes have been widely investigated in order to understand regional crustal deformation (Li, 1991; Tang et al., 1991; Harrison et al., 1992; Chen et al., 1994; Zhao et al., 1994; Burcheiel et al., 1995; Arne et al., 1997; Clark and Royden, 2000; Kirby et al., 2000, 2002; Zhou et al., 2000; Li et al., 2001; Toda et al., 2008; Royden et al., 2008). Tectonic activities like uplift could be recorded by a flight of fluvial strath terraces on river banks (Cunha et al., 2008; Gong et al., 2014; Fu et al., 2016), especially in the Tibetan Plateau and nearby regions (e.g., Lavé and Avouac, 2001; Vance et al., 2003). The Minjiang River situated at the eastern margin of the Tibetan Plateau (Figure 1) is the main tributary of the Yangtze River and has been widely investigated to understand the relationship between river erosion and tectonic movements (Figure 1; Tang et al., 1991; Chen et al., 1994; Zhao et al., 1994; Kirby et al., 2000; Zhou et al., 2000; Yang et al., 2003; Li et al., 2005; Ma et al., 2005; Gao and Li, 2006; Wu et al., 2009; Liu et al., 2013). On the other hand, fluvial incisions along the banks of the Minjiang River and its tributary have also induced a number of large rockslides (Kirby et al., 2002; Wang et al., 2011; Wang et al., 2012; Zhao et al., 2019; Wu et al., 2020). This means that the fluvial sediments and terraces of the Minjiang River can be archives of change in geomorphology and tectonic conditions of the region and can provide temporal information.
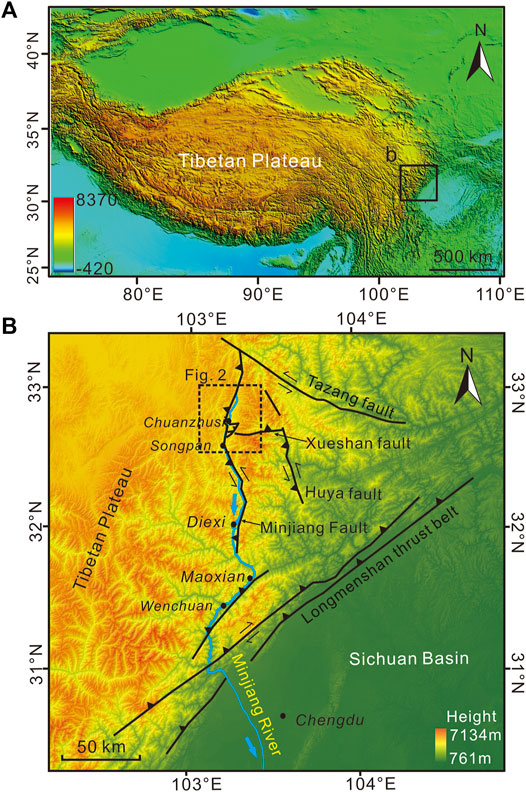
FIGURE 1. DEM showing the location of the study area. (A) The Minjiang River is situated on the eastern margin of the Tibetan Plateau close to the Sichuan Basin, and (B) the enlarged image showing the reaches of the Minjiang River between its source and the basin, and the faults in the study area which are from Kirby et al. (2000) and Tan et al. (2019).
In the previous studies, the formation ages of the Minjiang River terraces were determined using various dating techniques including radiocarbon (Kirby et al., 2000), thermoluminescence (TL) (Tang, et al., 1991; Chen et al., 1994; Zhao et al., 1994; Zhou et al., 2000; Li et al., 2005; Ma et al., 2005; Gao and Li, 2006), infrared stimulated luminescence (IRSL, Kirby et al., 2000) and electron-spin resonance (ESR, Yang et al., 2003; Liu et al., 2013). However, the reliability of some of the ages obtained using these techniques requires further assessment. This is because 1) charcoal fragments within fluvial deposits might be from reworked sediments and re-deposited, and the upper age limit of radiocarbon dating is usually less than 40 ka; 2) TL and ESR signals from sediments are generally difficult to bleach, especially for those from fluvial sediments; 3) feldspar IRSL signals usually suffer from anomalous fading (Spooner, 1994). The former two could result in age overestimation, and the third in age underestimation. Additionally, loess deposits overlying fluvial sediments were sampled for TL dating (Chen et al., 1994; Kirby et al., 2000), the loesses may be much younger than the underlying fluvial sediments (Yan et al., 2018; Zhang et al., 2020). But their OSL ages can represent the minimum ages of terrace-tread formation. On the other hand, the published age data for the Minjiang River terraces are not enough to build a robust chronological frame for the terrace sequence of the whole river. Recently, optically stimulated luminescence (OSL) signals of quartz have been widely and successfully used to date fluvial sediments because quartz OSL signals are more easily reset by light exposure (Perkins and Rhodes, 1994; Aitken, 1998; Wallinga, 2002; Rittenour, 2008; Rhodes, 2011; Zhang et al., 2003; Zhang et al., 2009).
In this study, we investigated the fluvial terraces of the Minjiang River in the Songpan area from Hongqiaoguan to the Songpan town in the upper reaches of the river (Figures 1B, 2), where fluvial sediments and bedrock strath can be observed in exposures. In the field, we first found the exposures of fluvial layers on the banks of the river and their bottoms (bedrock straths), and measured the elevations of the straths above the modern river level (amrl), and sampled fluvial sediments and loess deposits on terraces for OSL dating. The strath terraces were mainly defined by the elevations of bedrock straths and their dated ages. The samples were OSL dated on quartz grains. The reliability of the OSL ages obtained for all samples was evaluated first by analyzing luminescence properties and next by stratigraphic and geomorphological consistency. The age values obtained for some terraces were used to calculate river incision.
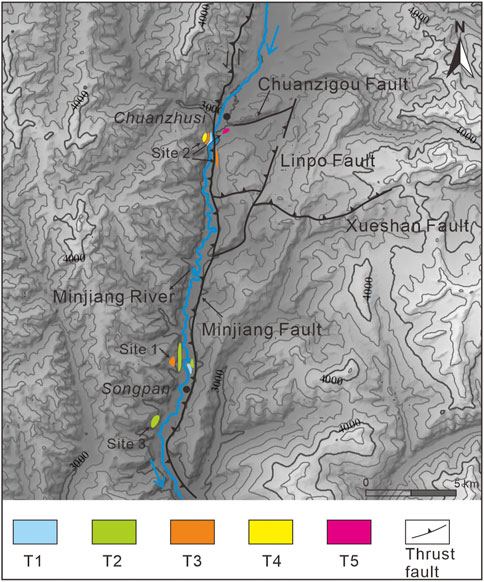
FIGURE 2. DEM image showing the sites (marked as sites 1–3) investigated in the Songpan area, and the distribution of the seven fluvial terraces and the faults (Kirby et al., 2000).
2 Geological and Geomorphological Settings
The eastward extrusion of the Tibetan Plateau during the Indo-Asian collision results in upper crustal shortening at the eastern margin of the plateau and the formation of the Min Shan and Longmen Shan (Chinese “shan” = mountain) to the north of the Sichuan Basin during the Cenozoic (Figure 1; Kirby et al., 2000, 2002; Hubbard and Shaw, 2009; Hetzel, 2013). The marginal region is characterized by greater topographic relief than anywhere else on the Tibetan plateau (Hubbard and Shaw, 2009), as demonstrated by a series of rugged high mountain peaks, steep ridges, and narrow and deep valleys. The topographic elevation ranges from ∼5,000 m above sea level (asl) for mountains in the eastern Tibetan Plateau to ∼600 m asl for the Chengdu Plain within the Sichuan Basin within the horizontal distance of 50–60 km. The Min Shan (its main peak (Mount Xuebaoding) with an altitude of 5,588 m asl) is a north-south-trending mountain that extends 150 km long and 50–60 km wide (Zhao et al., 1994; Zhou et al., 2000; Zhang et al., 2006a; Zhang et al., 2006b). Landslides occur in large numbers along the Minjiang River, resulting in the formation and failure of landslide dams on the river (Wang and Meng, 2009; Chigira et al., 2010; Gorum et al., 2011; Luo et al., 2019; Zhao et al., 2019), which strongly influence fluvial processes of the river.
The Minjiang River along the eastern margin of the Tibetan Plateau originates from the Gongga watershed, runs through the Min Shan, and enters into the Sichuan Basin. A large number of sediments have been brought to the basin, where the sediments reach up to 500 m in thickness (Wang and Meng, 2009). The elevation of the mountains in the catchment of the river varies between ∼5,000 m asl and ∼1,000 m asl. This transition zone between plateau and basin belongs to the transitional belt between the Songpan-Ganzi orogenic belt and Longmen Shan tectonic belt (Tang et al., 1991; Chen et al., 1994; Li et al., 2005). In the Songpan area, as mentioned above, fluvial terraces have been wildly studied. However, different numbers of terraces have been reported: five terraces (Tang et al., 1991), three terraces (Zhao et al., 1994), or two terraces (Chen et al., 1994; Kirby et al., 2000), suggesting the complicated geomorphological situation of the study area and the need for further investigations.
3 Methodology
3.1 Field Work and Sampling
The original stair-stepped topography of fluvial terraces in the study area is not directly observed on topographic maps, satellite images, or air photos, because the terraces were found as isolated and local remnants, and not continually distributed along the two steep banks of the river. The identification of terraces was conducted by observing fluvial sediments exposed on natural outcrops or road cuts and the bottom of the sediment overlying bedrock surface (strath). The elevations of terrace straths and treads (here the “tread” is referred to as the near-horizontal top surface of fluvial deposits, including channel or overbank facies resting on terrace straths) above the modern river level and the thickness of the terrace deposits were measured using a laser rangefinder (TruPulse 200X, distance accuracy: 4–30 cm) and a tape measure. The precise locations and altitude of the exposures were recorded using a hand-held global positioning system (GPS) receiver with a barometric altimeter (Garmin GPSmap 60CSx) with an accuracy of ±∼3 m in altitude. The stratigraphy and lithology of the exposures were described in detail. Here, three localities in the area were carefully investigated and the terrace remnants were mapped on a 1:50,000 topographic map (Figure 2).
In order to constrain the formation ages of the terraces, loess and fluvial sediments atop terrace straths were taken for OSL dating. The OSL dating of the loess samples is twofold: 1) the luminescence properties of the quartz grains from the loess samples can be used to evaluate the luminescence behaviors of fluvial sediments, and 2) the OSL ages of the loess samples can be regarded as the minimum age estimates of terrace formation. It is noted that some stratigraphically parallel samples (from the same depth, and the horizontal distance between the sampling holes is less than 30 cm) were collected for assessing the validity of OSL ages obtained. Sampling was done by hammering 3.5-cm-diameter and 20-cm-long stainless-steel tubes horizontally into freshly cleaned sections. The tubes were filled completely and wrapped with aluminum foil and adhesive tape in order to avoid the risk of sediment mixing and prevent further exposure to light and moisture loss during transport.
3.2 Luminescence Dating
Sample preparation was carried out in a dark room with subdued red light at Peking University. The 2-cm-thick materials at the ends of each sample tube, which may have been exposed to daylight, were removed and used for water content and dose rate measurements. The remaining interior part of the tube was treated with 10% HCl to dissolve carbonates, and 30% H2O2 to remove organic matters, respectively. The samples were then dried and sieved to select the fractions of coarse (>90 μm in diameter) or medium (63–90 μm) grains. The fractions were then immersed in 40% HF for 40 min to remove feldspar contaminants and the outer layer of quartz grains affected by alpha radiation, followed by a wash in warm 10% HCl and deionized water. The extracts were then sieved again to remove grains <90 μm or 63 μm in diameter, respectively. The purity of the quartz fractions was tested by infrared stimulation (Duller, 2003). Negligible IRSL signals were detected, indicating that the feldspar contaminants were successfully removed. Finally, the chemically purified quartz extracts were mounted as a 2 mm diameter (small aliquot, Duller, 2008) monolayer of grains on an aluminum disc (9.8 mm diameter) using silicone oil as an adhesive.
All luminescence measurements, beta irradiation and preheat treatments were carried out in an automated Risø TL/OSL-15 luminescence reader equipped with a 90Sr/90Y beta source (Bøtter-Jensen et al., 1999). Blue light (470 ± 30 nm) LED stimulation (90% of 50 mW/cm2 full power) was used for OSL measurements. Luminescence was detected by an EMI 9235QA photomultiplier tube with a 7.5 mm Hoya U-340 filter (290–370 nm) in front of it.
The improved single-aliquot regenerative-dose (SAR) procedure was applied to measure the equivalent dose (De) of the quartz extracts (Murray and Wintle, 2000, 2003). The procedure employed at least five regeneration doses including a zero dose (to check recuperation), and two doses of the same magnitude at the beginning and end (to check sensitivity correction). The preheat and cut heat temperatures were set to 200°C and 160°C for 10 s, respectively, which were determined by preheat plateau and dose recovery tests (see following section). OSL signals were measured for 40 s at the sample temperature of 125°C, and 40 s bleaching at the sample temperature of 280°C at the end of each cycle was performed to reduce recuperation. The net initial OSL signals were derived from the decay curve, taking the first 0.64 s integral of the initial OSL signal, minus a background estimated from the last 3.2 s integral of a 40 s stimulation. The value of De was estimated by interpolating the sensitivity-corrected natural OSL onto the dose-response curve using the Analyst software (Duller, 2007). The error on individual De values was calculated using the counting statistics and an instrumental uncertainty of 1.0%.
The uranium, thorium and potassium contents of all samples were determined by neutron activation analysis (NAA). Water contents (mass of moisture/dry mass) were measured in the laboratory and are listed in Table 1. We consider that these as-sampled water contents cannot represent the in-situ water contents of the samples. The water contents used for dose rate calculation were assumed for each sample, and the relative uncertainty of 25% was assigned (see below, Section 6.1). The elemental concentrations were converted into effective dose rates, and ages were calculated using the online dose rate and age calculator DRAC v1.2 (Durcan et al., 2015), in which cosmic ray contribution and dose-rate conversation factors (Guerin et al., 2011) are involved, the alpha (Brennan et al., 1991) and beta (Guerin et al., 2012) grain attenuation factors were used.
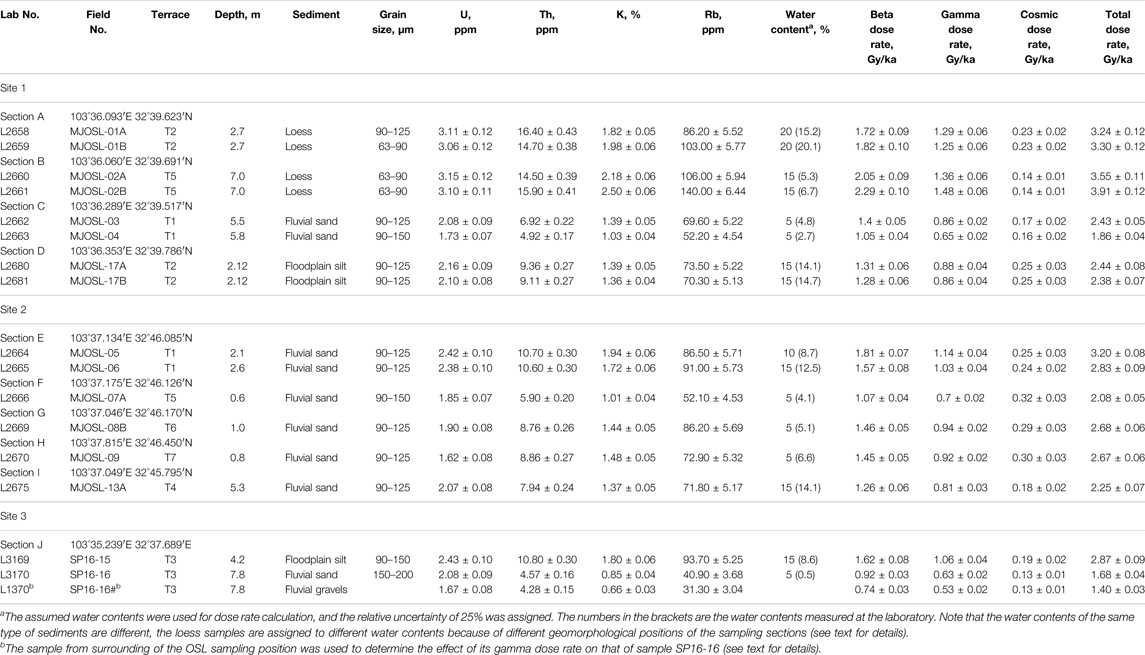
TABLE 1. Dose rates of the samples from the Minjiang River.
4 River Terraces and Optically Stimulated Luminescence Samples
A total of ten exposures (Sections, numbered A to J) were carefully investigated in the three sites (Figure 2, numbered 1 to 3) in the study area, and two of them are displayed in Figure 3. Here the sediments overlying fluvial gravels are divided into loess and floodplain deposits. The loesses are characterized by a massive, loose, and porous structure with vertical joints (Figure 3A). They spread out continuously over the terraces, hillslopes, and mountains. The thickness is locally more than 10 m. The floodplain deposits are characterized by horizontal bedding structures, and they are distributed locally on the terraces. Combined with the elevations of straths, a series of fluvial terraces were identified and numbered from T1 youngest to T7 oldest (Figures 4A–D), they are described below, although fluvial terraces may suffer from the deformation or displacement in the active tectonic region.
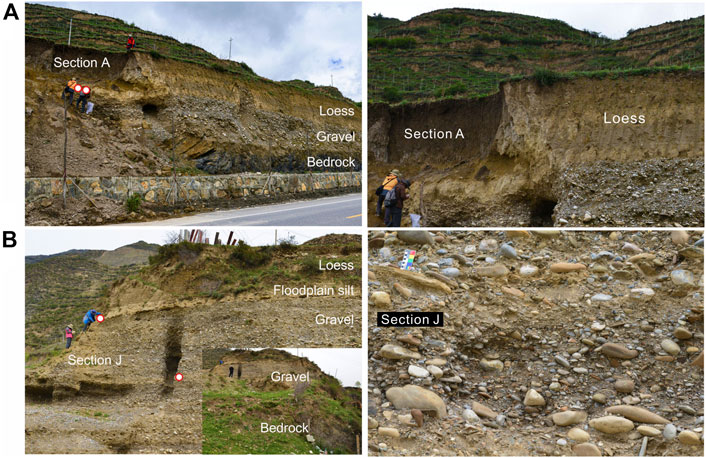
FIGURE 3. Photographs showing Section A at site 1 (A) and Section J at site 3 (B), which represent two terrace sections. Enlarged views of the loess deposits in Section A and gravel deposits in Section J on the right showing details of their sedimentary characteristics.
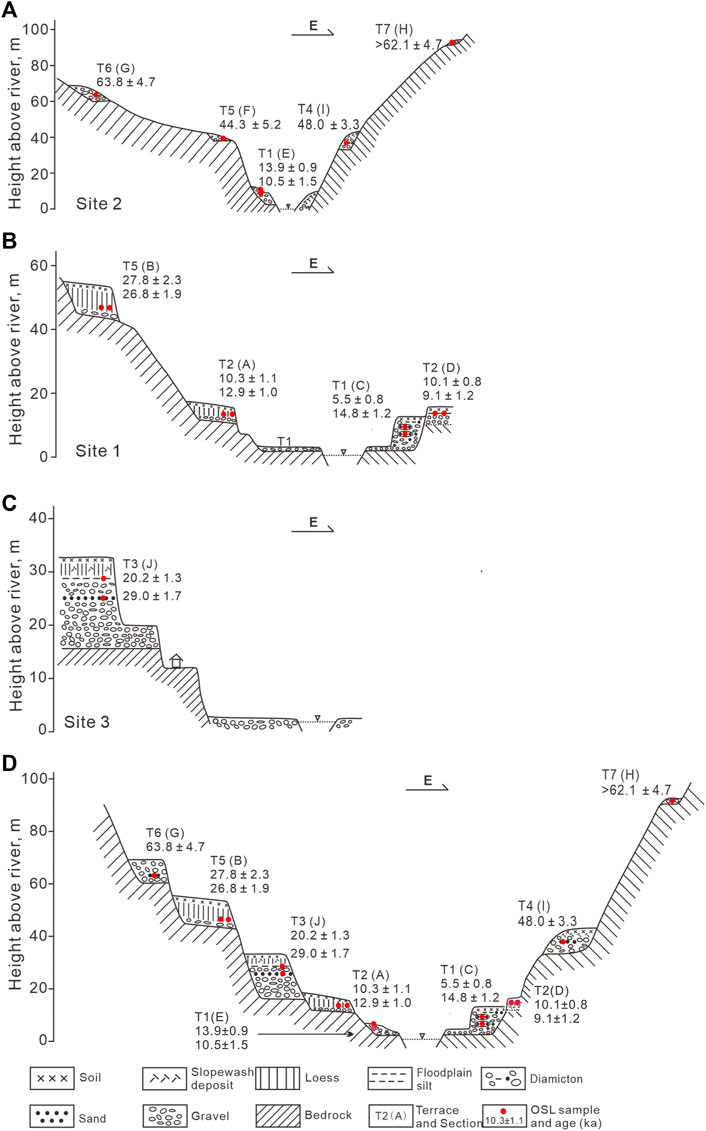
FIGURE 4. Terrace profiles of the Minjiang River in the Songpan area. The localities of sites 2 (A), 1 (B) and 3 (C) and the sections (letters in brackets) on the terraces are shown in Figure 2. The CAM ages obtained for the samples are displayed (see text for details). (D) Composite section showing all terraces found in the study area.
4.1 Site 1
Four exposures (Sections A–D) at site 1 located in the north of the Songpan town were found on the two banks of the river (Figures 2, 4B), and represent the T1, T2, and T5 terrace sections, respectively. The first terrace (T1) can be observed on the two banks of the river, and the elevation of strath above river bed is about 2.1 m (Figure 4B). This paired strath terrace is characterized by different deposits on the straths of the west and east banks and a broad and flat tread. The strath on the west bank is overlain by a thin veneer of fluvial gravels, but the deposits on the east bank are more complicated and this terrace reaches the thickness of about 9.8 m (Section C). The bottom layer mantling the strath in Section C is composed of the same well-rounded sandy gravels as in the west bank. The gravel layer is overlain by diamicton, which is sandy with significant contents of clay, silt, and some gravels. The diamicton exhibits weakly bedding and is poorly sorted, within which the gravels are well-rounded and matrix-supported. Lenses of laminated sand are found and sampled for OSL dating (samples MJOSL-03 and 04). The diamicton may be interpreted as solifluction sediment, which was deposited after the formation of the terrace. It is noted that solifluction is widespread on the hillslopes in the study area.
The remnants of the second terrace (T2) at site 1 were also found in the two banks (Figure 4B), and the terrace deposits are represented by Section A on the west bank and Section D on the east bank. Section A shows that the terrace deposits consist of channel gravels directly overlying bedrock (the elevation of the bedrock strath is about 9.8 m amrl), this gravel layer with a thickness of 2.5 m is overlain by 3-m-thick loess deposits (Figure 3A). The gravel deposits are clast-supported and matrix poorly sorted, and mainly composed of well-rounded limestone pebbles and cobbles. Section D on the east bank is composed of gravels and overlying grey mud. The bottom of the gravel layer was not seen and measured. The mud (floodplain silt) is 2.1 m thick, and note that it is difficult to understand the origin of this grey mud in the field. The elevation of the terrace tread for Section D is ∼14.9 m amrl. The remnant of the T5 terrace was found on the west bank of the river, with an elevation of ∼45 m amrl, and the terrace deposits shown in Section B are the same as those for the T2 terrace. The thicknesses of the gravel and loess layers are 2.7 and 8.1 m, respectively. No sand lenses in these three sections and floodplain silt were found within the gravel layers. In this case, three sets of parallel loess or mud samples for OSL dating for the three sections were taken from positions ∼40 cm above the gravel layer (Table 1; Figure 4B).
4.2 Site 2
Five exposures (Sections E, F, G, I, and H) on the two banks of the river were observed at site 2 located at Hongqiaoguan, and represent the remnants of four terraces named T1, T4, T5, T6, and T7 (Figure 4A). The remnants indicate the very narrow treads of the terraces. The deposits on the T1 terrace are composed of channel gravel unit, floodplain silt/fine sand unit, and slopewash deposits on top of the fluvial sediments. The yellow floodplain silt/fine sands are well sorted, and horizontal or nearly horizontal beddings can be observed on the fresh section surface, from which two samples for OSL dating were collected. It is noted that the boundary between the gravel and floodplain silt/fine sand units was not seen due to road construction. The elevation of the bedrock strath is about 2.3 m amrl. The other four sections are mainly composed of sandy gravels that are similar to those for Section A, sand lenses within gravel layers were found and sampled for OSL dating. For Section I, 0.5 m-thick slopewash deposits overlie the gravel unit. The elevations of the terrace straths are shown in Figure 4A.
4.3 Site 3
A complete section (Section J) was exposed in a sand pit at site 3 on the west bank of the river on the south of the Songpan town (Figures 3B, 4C), and shows sediments on the T3 terrace. It can be seen that the sandy gravel layer overlying slate bedrock strath is ∼12.6 m thick and exhibits horizontal bedding. The clast-supported gravels with interstitial matrix of poorly sorted sand are mainly composed of well-rounded limestone pebbles and cobbles and a few slate cobbles with weak clast long-axis imbrication. The coarse sand matrix is slightly cemented. The gravels in the middle of the layer are intercalated by a 0.3-m-thick sand horizon from which sample SP16-16 was taken. The 0.7-m-thick floodplain sandy silt layer overlying the gravel layer shows well-developed horizontal bedding, from this layer sample SP16-15 was collected. The upper layer consists of a 3.8-m-thick loess and slopewash deposits within which there are some slate fragments. The height of the bedrock strath is about 14.1 m arml.
5 Dating Results
5.1 Luminescence Properties
An example of the dose-response and decay curves for our samples is shown in Figure 5. The decay curve for sample MJOSL-13A shows that the quartz OSL signal is reduced rapidly within the first 2 s of stimulation. The comparison of the signal with that from a standard calibrated quartz sample from Risø National Laboratory indicates that, although the reduction of the signal from sample MJOSL-13A during stimulation is much less complete than that of the signal from the standard sample, the intensity of the OSL signal from sample MJOSL-13A is relatively stable after 5 s stimulation than the signal from the standard sample. This implies that the quartz OSL signals from our samples are dominated by the fast component, and were easily bleached prior to burial, indicating that the signals can be used for De measurement with the SAR protocol (Wintle and Murray, 2006). The dose-response curve in Figure 5 is well fitted by a single saturation exponential function. The repeat point is in good agreement with the first regenerated dose point, suggesting that the correction for sensitivity change is successful. The sensitivity-corrected OSL signal produced by a zero dose is close to zero, indicating that thermal transfer (recuperation) during De measurement is negligible. It is noted that all the dose-response curves demonstrate that all the measured aliquots are not saturated. However, some aliquots exhibited large thermal transfer (recuperation ratios are >5%), and/or have recycling ratios (the ratio between two duplicate regenerative dose points) beyond the range of 0.9–1.1, these aliquots were excluded for further analyses.
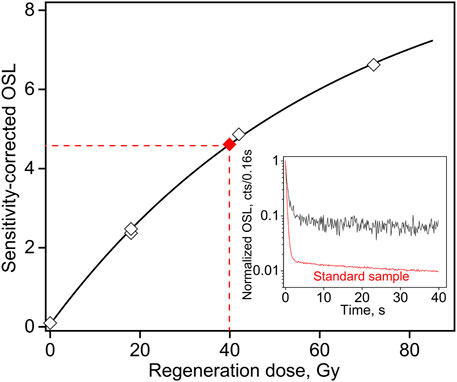
FIGURE 5. Dose-response curve for a quartz aliquot of sample MJOSL-13A. The regenerated sensitivity-corrected and the natural OSL signals are displayed as open and red solid diamonds, respectively. The regeneration data are fitted using a saturation exponential function. Inset shows a natural OSL decay curve for the aliquot, and a decay curve for a standard calibrated quartz sample from Risø is presented for comparison.
To determine an appropriate preheat temperature for our samples, preheat plateau tests were performed on sample MJOSL-13A using the SAR procedure with the preheat temperatures ranging from 160 to 280°C at 20°C intervals. Three aliquots were measured for each preheat temperature. The De values shown in Figure 6A indicate no dependence on preheat temperatures from 180 to 240°C when errors are considered. The recycling ratios are close to unity at temperatures from 160 to 220°C, and the recuperation ratios are less than 5% except for one aliquot for all preheat temperatures. To further confirm the De plateau, dose recovery tests were carried out on the same sample (MJOSL-13A) as used in the preheat tests. In the dose recovery tests, the nature OSL signals in quartz aliquots were first removed by exposure to the blue light within the OSL reader for 100 s at room temperature. After 18,000 s, the aliquots were then stimulated for 40 s by the blue light to check residual signals, and no detectable luminescence signals were observed. The aliquots were given a beta dose of 46.2 Gy equivalent to the average equivalent dose of the sample. This given dose was taken as a natural dose for the following De measurements. The aliquots were then measured using the same SAR procedure as used in the preheat plateau tests to measure the “equivalent dose”. The results displayed in Figure 6B show that the dose recovery ratios (measured “equivalent dose”/given dose) are close to unity within errors in the temperature range of 160–240°C. The recycling ratios for most of the aliquots are close to unity, and have the recuperation ratios <5% for the whole preheat temperatures. Based on the results of the preheat plateau and dose recovery tests, a preheat of 200°C for 10 s was applied in the SAR procedure for De measurements.
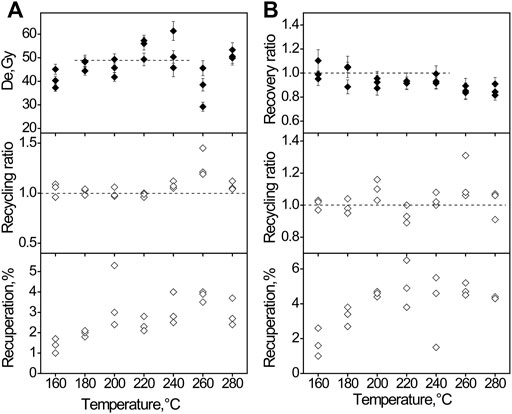
FIGURE 6. The results of preheat plateau tests (A) and dose recovery tests (B) for sample MJOSL-13A.
5.2 De Distribution
Twenty–forty-six aliquots (Table 2, number in brackets) of each sample were measured, and 12–36 of them passed the SAR rejection criteria (recycling ratios of 0.9–1.1, recuperation <5%) for each sample and were accepted for final De analysis. The De distributions are displayed in Figure 7 and Supplementary Figure S1 and the degree of scatter in De values is evaluated by overdispersion (OD) values calculated using the central age model (CAM) (Galbraith et al., 1999). The results show that the studied samples have the OD values of 23%–56%, with an average of 36.9% ± 2.5%, which are much larger than the global average values of 14% ± 1% and 9% ± 1% published for well-bleached medium-sized aliquots (100–1,000 grains per aliquot) and large-sized aliquots (>1,000 grains per aliquot), respectively (Arnold and Roberts, 2009). Large OD values may indicate the heterogeneous bleaching of sediments at the time of deposition. In this case, the simplified minimum age model (MAM-3) of Galbraith et al. (1999) was used to obtain the “true” burial doses of the samples with the “luminescence package” program (Kreutzer et al., 2012). The σb parameter, representing the De scatter that cannot be explained by heterogeneous bleaching of quartz grains, should be determined before the De analysis using the MAM model. OD values obtained from dose recovery tests are generally considered to represent those of well-bleached samples from the same sources. Therefore, the OD value obtained from the dose recovery tests is generally used as the σb value in the MAM model (Galbraith and Roberts, 2012). In this study, the OD value from the dose recovery test on sample MJOSL-13A is 5% ± 2%. Considering beta-dose heterogeneity (Jankowski and Jacobs, 2018; Fu et al., 2022), published OD values for small aliquots of fluvial sediments (Arnold and Roberts, 2009), and the values from the experiments and modeling for multi-grain analyses (Rodnight et al., 2006; Cunningham et al., 2011), σb = 0.15 ± 0.05 was used in our MAM calculation. Additionally, CAM De values were also calculated (Galbraith et al., 1999). The calculated CAM De values (Table 2) range from 13.3 to 170.9 Gy with relative errors from 5.3% to 13.8%, with a mean value of 8.4% ± 0.7%, and the MAM De values from 4.6 to 144.1 Gy with relative errors from 4.3% to 25.2%, with a mean value of 15.4% ± 1.4%.

TABLE 2. OSL dating results of the samples from the Minjiang River.
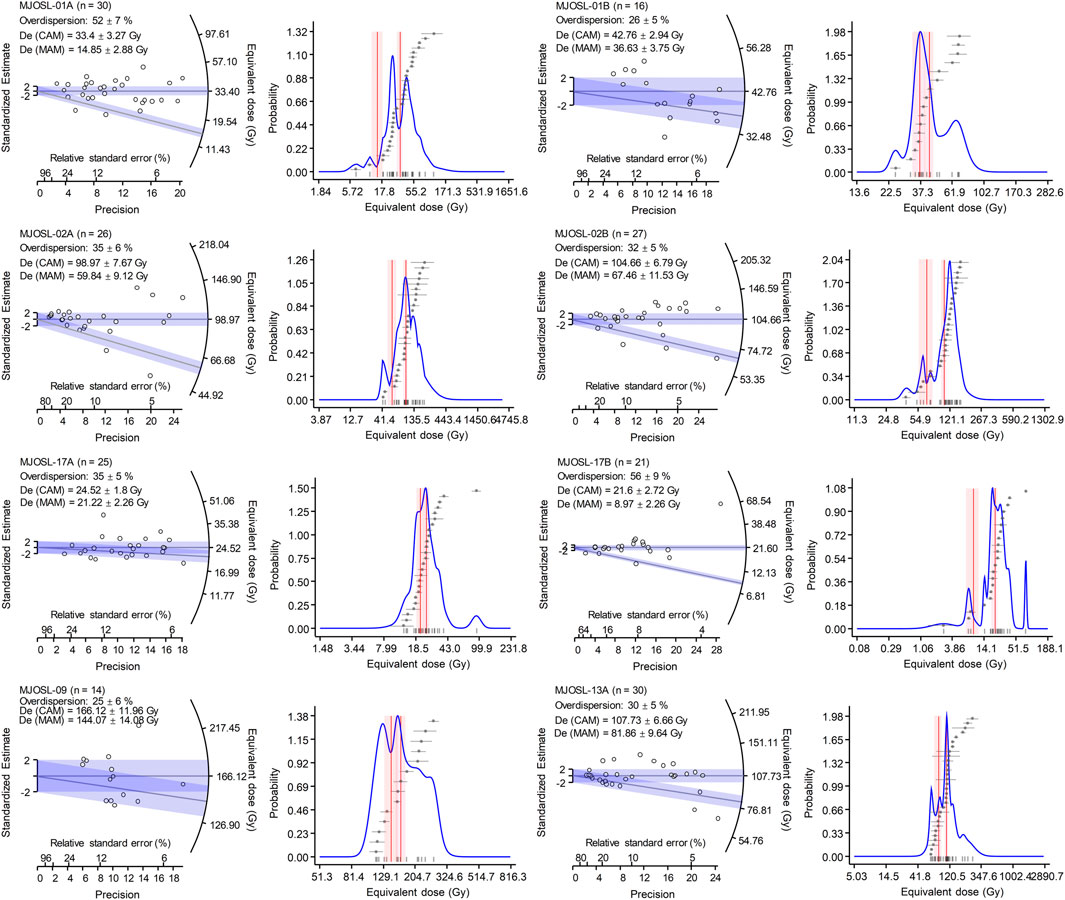
FIGURE 7. Radial plots and probability density function (pdf) plots showing the De distributions, which were produced by the LDAC program (V1.0) provided by Liang and Forman (2019). The two shaded areas refer to the 2σ range for the CAM and MAM De values.
5.3 Optically Stimulated Luminescence Ages
The U, Th, and K contents, water contents, and calculated dose rates of the samples are summarized in Table 1. It shows that the U, Th, and K contents are about 1.62–3.15 ppm, 4.57–16.4 ppm, and 0.85%–2.50%, respectively, the large ranges of the content indicate the chemical heterogeneity of the samples. The total dose rates were calculated to be about 1.68–3.91 Gy/ka. The beta and gamma contributions are about 54%–59% and 34%–40% of the total dose rates, respectively. It is noted that the cosmic dose rate is up to 0.32 Gy/ka due to the high altitude. Both CAM and MAM ages for a sample were calculated by dividing the CAM and MAM De values by the total dose rates, and the ages obtained for all the samples are presented in Table 2. The CAM ages are from about 6 to 64 ka, and the MAM ages from about 2 to 54 ka which are much smaller than the corresponding CAM ages.
6 Discussion
6.1 Reliability of Optically Stimulated Luminescence Ages
6.1.1 Dosimetry
The internal consistency of the calculated dose rates between parallel samples for the three sets of parallel samples (MJOSL-01A and 01B, 02A and 02B, 17A and 17B) gives us confidence in our NAA analysis. However, particular attention is needed to the measured water contents, which (0.5%–20.1%) (Table 1, values in brackets) vary significantly from sample to sample, even for the parallel samples or the same type of sediments. It is obvious for some of the samples that their true long-term water contents were significantly underestimated if the measured water contents were used. This may be attributed to the following factors: 1) sediments near section surface had been partly dried up when sampling, 2) the water contents of some samples are associated with their geomorphological positions as suggested by field observation, and 3) the as-sampled water contents are influenced by local weather several days before sampling. In this case, reasonable water contents are assumed for different samples according to the as-sampled water contents, geomorphological positions, and sediment types, and the assumed relative uncertainty of 25% (1σ) is large enough to cover water content fluctuations through time at a 2σ confidence level. Additionally, it is noted for sample SP16-16 that the sampled sand layer is only 0.3 m in thickness. In this case, the contribution of gamma from the overlying and underlying sediments needs to be considered, because of the possible difference in the radionuclide concentrations between the sampled layer and the overlying and underlying sediments. Usually, an at least a 30 cm distance between the sampling position and a stratigraphic boundary is required when using the U, Th, and K contents of the dated sample to calculate its infinite-matrix dose rate, because the contribution of gamma to dose rate is from a sphere with a radius of about 30 cm in sediments, whereas beta particle has a range of several millimeters. For this sample, the contributions of the beta, gamma, and cosmic dose rates obtained from its U, Th, and K contents to the total dose rate are 54.8%, 37.5%, and 7.8%, respectively. To evaluate the effect of gamma from the overlying and underlying sediments, a sample (SP16-16#) (a large amount of sandy gravels) was collected from the overlying and underlying layers and analyzed for its U, Th, and K contents. The results shown in Table 1 indicate a slight difference in radioactive concentrations between samples SP16-16 and -16#. In this case, the true gamma dose rate for this sample was evaluated using the model described by Aitken (1998: appendix H). The modeling dry gamma dose rate of 0.65 ± 0.02 Gy/ka obtained for sample SP16-16 was transferred to the wet dose rate of 0.61 ± 0.02 Gy/ka, which is consistent with the gamma dose rate of 0.63 ± 0.02 Gy/ka within errors calculated from the U, Th and K contents of sample SP16-16. This suggests that the effect of the gamma from the overlying and underlying sediments on sample SP16-16 is negligible when errors are considered. For consistency, the gamma dose rate of 0. 63 ± 0.02 Gy/ka was used for age calculation.
6.1.2 Comparison of Central Age Model and Minimum Age Model Ages
As mentioned above, some aliquots were rejected for failing the SAR rejection criteria (Wintle and Murray, 2006). The De values of the aliquots demonstrating luminesce properties suitable for the application of the SAR protocol were used for further analysis. The largest CAM De value obtained for our samples is 170.9 ± 12.1 Gy for sample MJOSL-08B from the T6 terrace, corresponding to the OSL age of about 64 ka. The De distribution of this sample is shown in Supplementary Figure S1, the single aliquot De value of 256 ± 27 Gy is the largest among the aliquots measured for this sample. The characteristic saturation dose (D0) of the dose-response curve for this aliquot was calculated to be 190 Gy, showing that the age of the sample is within the maximum range of quartz luminescence dating (Wintle and Murray, 2006).
It is well known that dating fluvial sediments may encounter a partial bleaching problem, especially for young samples. Poorly bleached samples often show a wide, asymmetric distribution in De when small aliquots are analyzed (e.g., Duller, 1994; Murray et al., 1995; Olley et al., 1998; Olley et al., 1999; Lepper and McKeever, 2002; Wallinga, 2002; Spencer et al., 2003). For such partially bleached samples, their MAM ages are generally considered to represent the true burial ages of well-bleached grains (Galbraith et al., 1999). However, the application of the MAM to some samples may result in significant age underestimation (e.g., Thomsen et al., 2016; Singh et al., 2017; Murray et al., 2021). In this study, the samples exhibit large OD values ranging from 23% to 56%, even for the four loess samples (grain size of 63–90 µm was used for three samples) with an average OD value of 36.3% ± 5.6%. For the application of MAM (Galbraith et al., 1999), the appropriate value of σb is needed, this σb represents the expected overdispersion caused by factors such as counting statistics and instrument reproducibility except for incomplete bleaching. It is known that the De overdispersion is caused by many factors such as partial bleaching, post-depositional mixing, and microdosimetry except for measurement errors. In reality, it is difficult to identify and quantify the factors, among which one contributes to the size of the overdispersion. Galbraith and Roberts (2012) suggest the use of a well-bleached sample of similar origin and age with which to measure OD. Here the average OD value of the four loess samples is not used as σb required in MAM for the fluvial samples because of their different origins. The OD value of 36.3% ± 5.6% for loess samples is larger than those of most of the fluvial samples. If it is used as σb in the MAM calculation for our fluvial samples, the CAM and MAM ages obtained will be similar. In this study, the MAM ages obtained using the σb of 0.15 are compared with the CAM ages in Figure 8. It shows that the MAM underestimates the CAM by 5.3%–65.3% with an average of 33.2% ± 4.5% for all the samples including the loess samples (Figure 8A). The figure also demonstrates that the De difference (CAM-MAM) broadly increases with the CAM ages (inset in Figure 8B). The trend of an increasing difference with increasing CAM age is difficult to interpret using the degree of bleaching of OSL signals at the time of deposition (residual doses). This is supported by the fact that published residual doses of sand-sized quartz from modern fluvial sediments at the time of deposition are generally less than several Gy (e.g., Jain et al., 2004; Alexanderson, 2007; Hu et al., 2010; Hu et al., 2015; Toth et al., 2017; Chamberlain and Wallinga, 2019; Yan et al., 2021). For this case, as suggested by Thomsen et al. (2016) and Singh et al. (2017), the CAM ages may be more reliable.
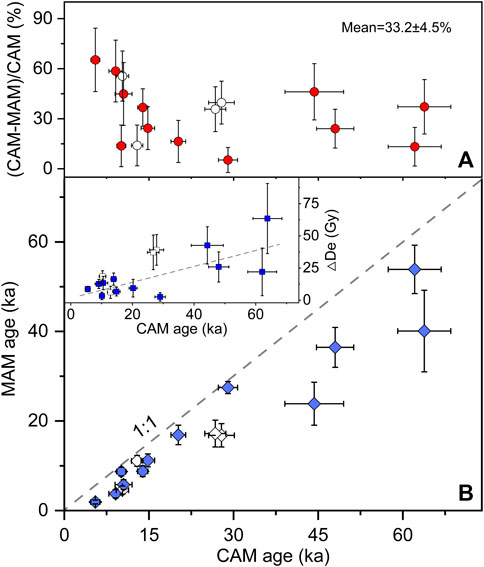
FIGURE 8. (A) Plot of the relative difference between MAM and CAM ages as a function of the CAM ages, (B) comparison of the MAM and CAM ages, and the inset shows the difference (△De) between MAM and CAM De values. The open points refer to loess samples.
The validity of the CAM and MAM ages is further checked using lithostratigraphic and geomorphological consistency. Three sets of parallel samples (MJOSL-01A and 01B, 02A and 02B, 17A and 17B) were measured to assess the reliability of the dating results. The OSL ages of parallel samples should have similar OSL ages. This is because each set of parallel samples was collected from the same depth, and the horizontal distance between the sampling holes is less than 30 cm. The results show that the loess parallel samples (MJOSL-01A and 01B) from Section A were measured using different grain sizes of quartz, their CAM ages are consistent within 2σ uncertainty level errors but their MAM ages are completely inconsistent. This is also the case for the fluvial parallel samples (MJOSL-17A and 17B). The other loess parallel samples (MJOSL-02A and 02B) from Section B have similar CAM and MAM ages, respectively. This comparison implies that the CAM ages appear to be more reliable. All these indicate that the CAM ages are more reasonable. Accordingly, we consider the CAM ages to be relatively more reliable and used for further analyses.
6.2 Terrace Ages
6.2.1 Terrace T1
As shown in Figure 4, the four samples from the T1 terrace at sites 1 and 2 were, respectively, dated to 14.8 ± 1.2 and 5.5 ± 0.8 ka for Section C and 10.5 ± 1.5 and 13.9 ± 0.9 ka for Section E. The comparison shows that the value of 5.5 ± 0.8 ka cannot represent the formation age of the terrace. The other values are consistent within errors, although sample MJOSL-04 (14.8 ± 1.2 ka) from a sand lens within the diamicton overlying the fluvial gravel layer. The age consistency also suggests that deposition of the diamicton was contemporaneous with the formation of the terrace. In this case, these consistent ages were combined to obtain a single weighted mean age estimate, it was calculated to be 13.5 ± 0.6 ka. Thus, we consider that the formation age of the terrace is 13.5 ± 0.6 ka.
6.2.2 Terrace T2
The remnants of the T2 terrace were found on the east and west bank of the river at site 1, and four samples were collected from Sections A and D. The two loess samples from Section A yielded the OSL ages of 12.9 ± 1.0 and 10.3 ± 1.1 ka, and the two mud samples from Section D the ages of 9.1 ± 1.2 and 10.1 ± 0.8 ka, respectively. These four ages are consistent within errors and similar to the ages for the T1 terrace, suggesting that the loess and mud sediments overlying gravels on the two banks (Sections A and D) were deposited simultaneously and much later than the formation of the terrace. The terrace age should be older than the burial ages of the loess or mud samples. Based on the river incision rate (see below), the age of this terrace is deduced to be about 20 ka (Figure 9).
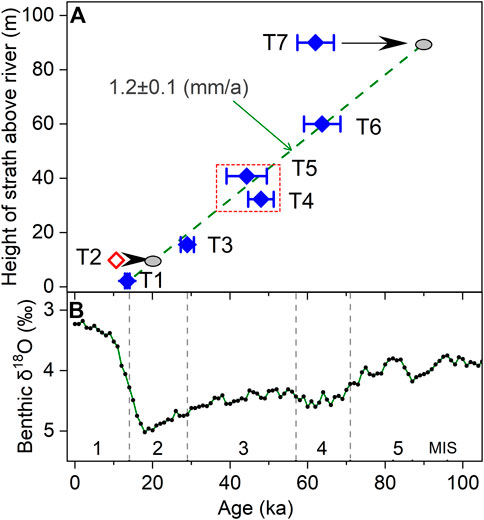
FIGURE 9. (A) Plot of terrace heights above modern river against terrace ages. The slope of the regression line represents the long-term incision rate derived from the T1, T3, T5, and T6 terraces. The measured ages of the T2 and T7 were underestimated, the true ages may be inferred from the regression line. The T4 and T5 terrace may be the same terrace. The open diamond refers to loess samples. (B) The oxygen isotope curve for comparison to terrace ages, MIS refers to the marine oxygen isotope stages (Lisecki and Raymo, 2005).
6.2.3 Terrace T3
At site 3, one overbank sample (SP16-15) and one sand sample (SP16-16) from the sand lens within the gravel layer from Section J were, respectively, dated to 20.2 ± 1.3 and 29.0 ± 1.7 ka, which are stratigraphically consistent. It is noted that the channel gravel layer at this site is very thick (up to 12.6 m). The vertical distance from the strath surface to the sampling point is about 9.3 m. The thick terrace deposits may lead to the difference in ages among the dated samples, the terrace tread and strath (Zhang et al., 2020). If the deposition of the gravels and overbank silts at this site were rapid, the ages of the terrace tread and strath are approximately equal to those (20.2 ± 1.3 and 29.0 ± 1.7 ka) of samples SP16-16 from the overbank silt layer and -17 from the gravel layer, respectively. On the other hand, if the deposition rate is relatively slow, the age of the dated sample could not directly represent the strath age, which is defined as the end of an interval of strath formation (Bull, 1991; Bull, 2007). Alternatively, tread and strath ages can be obtained by calculating a deposition rate for these sediments using an age-depth model (Zhang et al., 2020). We assumed an average deposition rate for the fluvial sediments and no hiatus between the two sedimentary facies, a deposition rate of 0.4 ± 0.1 m/ka was calculated based on the relationship between the ages and depths of the two fluvial samples. The terrace tread (top of floodplain silts) and strath (base of the gravels) were extrapolated to ∼19.2 and ∼51.7 ka, respectively. It is obvious that the extrapolated age of 51.7 ka for the strath is unreasonable because it is older than the age (∼47 ka) of the higher terrace (T4 and T5) (see below). In this case, we deduce that the measured age of 29.0 ± 1.7 ka is closer to the true strath age than that obtained from the age-depth model.
6.2.4 Terraces T4 and T5
The remnants of the T4 terrace were found on the east bank of the river at site 2. One sample from Section I was dated to 48.0 ± 3.3 ka (Figure 4A). The remnants of the T5 terrace were found at sites 1 and 2 (Figures 4A,B), and the two parallel loess samples (MSOSL-02A and 02B) overlying gravels from Section B at site 1 were, respectively, dated to 26.8 ± 1.9 and 27.8 ± 2.3 ka, which are much younger than the fluvial sand sample from Section F at site 2 which yielded the age of 44.3 ± 5.2 ka. This indicates that loess was deposited much later than the formation of the terrace. It is noted that the ages of the two samples from Sections I for T4 and F for T5 at site 2 are statistically consistent with errors, which may indicate that they are actually one terrace with the weighted mean age of 46.9 ± 2.8 ka, although they have slightly different elevations of bedrock strath. This needs further investigation.
6.2.5 Terraces T6 and T7
The remnants of the T6 and T7 terraces were found on the west and east banks of the river at site 2 (Figure 4A). The two fluvial sand samples from Section G for T6 and Section H for T7 were dated to 63.8 ± 4.7 and 62.1 ± 4.7 ka, respectively. Geomorphologically, the age consistency of these two samples is difficult to explain. This is because, for a series of strath terraces with different heights along a river valley, higher terraces usually formed earlier than lower terraces due to river incision if no tectonic activities had taken place. The elevation of the T7 bedrock strath is 90 m amrl, much higher than the T6 terrace strath (its elevation is 60 m amrl). The two terraces cannot form simultaneously. The most likely explanation for this situation is that the OSL age of the sample from T7 was underestimated, which cannot be explained by luminescence properties such as the shape of the dose-response curve, as shown by OSL dating of Yellow River terraces (Zhang et al., 2020; Yan et al., 2021). Based on the river incision rate (see below), the T7 terrace should be about 80 ka old (Figure 9).
6.2.6 Comparison With Previous Studies
Previous studies have reported that there are two fluvial terraces between Hongqiaoquan and the Songpan town: the lower terrace [called “the second terrace” by Chen et al. (1994) or “the Q3 terrace” by Kirby et al. (2000)] and the higher terrace [called “the third terrace’ by Chen et al. (1994) or “the Q2 terrace” by Kirby et al. (2000)]. The higher terrace is discontinuous, and its elevation (for tread or strath?) is 40 m at Hongqiaoquan and 25 m at Gaotunzi located at the middle position between Hongqiaouuqn and the Songpan town (Chen et al., 1994), it was deduced to be 25.4 ± 0.5 cal. ka BP, based on the radiocarbon dating of one charcoal sample from associated sediments (not terrace deposits) (Kirby et al., 2000). The lower terrace is a continuous strath terrace, and its elevation (tread or strath?) varies from 20 m at Hongqiaoquan in the north to 5 m in the south (Chen et al., 1994) or its tread ranges from 5 to 10 m (Kirby et al., 2000). It was TL dated to 23.6 ± 2 or 15.3 ± 1.2 ka (two sediment samples) (Chen et al., 1994), or radiocarbon dated to >14.0–6.6 cal. ka BP (two charcoal and one wood sample). Based on the elevation of the lower terrace tread, the lower terrace should correspond to the T1 terrace in this study. It is obvious that the quartz OSL dating in this study provides a more precise age for this terrace than radiocarbon or TL dating. The higher terrace may correspond to the T3 or T4 terrace in this study, but its inferred age of 25.4 ± 0.5 cal. ka BP is obviously underestimated compared with the ages of the T3 or T4 terrace in this study. Additionally, the recognition of the reported two terraces in this area is not supported by the ages obtained in this study.
6.3 Incision Rate and Its Implication
Elevations of terrace strath above a modern river level and strath ages are often used for calculating mean bedrock river incision rates (Maddy, 1997; Maddy et al., 2000), which are then used as proxies for rock-uplift rates (Merritts et al., 1994). Here, the strath ages and elevations above the modern river level of the T1, T3, T5, and T6 terraces were used for calculating the average incision rate between 14 ka for T1 and 64 ka for T6 (Figure 9). It can be seen that the regression defines a mean incision rate of 1.2 ± 0.1 mm/a for the time range of 14–64 ka. This calculated rate is similar to the inferred mean incision rate of ∼1.5 mm/a for the past ∼160 ka reported for this region (Kirby et al., 2000). Compared with the mean incision rates (∼0.35 mm/a for the past 70 ka) of the Yellow River in its middle reaches in the eastern Ordos Block (Guo et al., 2012; Zhang et al., 2020; Yan et al., 2021), the incision rate of 1.2 ± 0.1 mm/a implies that the studied tectonically active region has much larger incision or uplift rate during the Late Pleistocene than the stable Ordos Block in the northeastern margin of the Tibetan Plateau. Additionally, based on the mean incision rate of 1.2 ± 0.1 mm/a, we deduce that the T2 and T7 terraces were formed at ∼20 and ∼80 ka ago, respectively. It is interesting to note that the incision rate of ∼0.15 mm/a for the past 14 ka terrace was calculated based on the ages and heights of the T1 terrace, this rate is much smaller than that for the time period of 14–64 ka. The most likely explanation is that the river was dammed nearby by landslides triggered by river erosion or earthquakes (Zhao et al., 2019; Wu et al., 2020) during the Holocene, resulting in the rise of local base level and reduction of the incision.
Figures 2, 4D show that it is difficult to evaluate the effect of the activity of the Minjiang fault on the terraces. This is because there is no systematic difference in strath elevation and age between the two banks of the river or both sides of the fault. Figure 9 demonstrates that the T3 terrace was formed during the transition from marine oxygen isotope stages (MIS) 3 to 2, and the T1 terrace from MIS 2 to 1. The other terraces were formed at MISs 5, 4, and 3, implying that it is difficult to infer a simple relationship between terrace formation and climate conditions for all the terraces. Mount Xuebaoding, the highest mountain in the Min Shan region, has been occupied by glaciers. Four glacier events were recognized, and their time periods are >14.1, 15.6–11.2, 9.1–6.7, and 2.5–1.5 ka, respectively (Liu et al., 2018). The T1 terrace was formed in the glacier period of 15.6–11.2 ka. As pointed out by Vandenberghe (1995), any climate change can result in river incisions, which induces terrace formation in constantly uplifting areas (Ruszkiczay-Rüdiger et al., 2005; Pan et al., 2009). Therefore, we induce that for these terraces, the joint effect of the two driving forces (tectonics and climate) may be responsible for their formation.
7 Conclusion
Seven Minjiang River strath terraces were identified in the Songpan area from Hongqiaoguan to the Songpan town based on fluvial sediments and the elevation of bedrock strath. Fluvial samples and overlying loess samples on the terraces have large scatter in De . However, the MAM ages are considered unreliable, and the CAM ages are reliable based on the comparison of the ages between parallel samples, and stratigraphic and geomorphological consistency. The loess samples overlying fluvial sediments were deposited much later than the terrace formation. The T1, T3, T4, T5, and T6 terraces were dated to 13.5 ± 0.6, 29.0 ± 1.7, 48.0 ± 3.3, 44.3 ± 5.2, and 63.8 ± 4.7 ka, respectively. The T4 and T5 terraces may be the same terrace with a weighted mean age of 46.9 ± 2.8 ka. The ages of the T2 and T7 terraces were inferred to be ∼20 and ∼80 ka, respectively. The mean bedrock river incision rates are 1.2 ± 0.1 mm/a for the time period of 64 ka for the T6 terrace—14 ka for the T1 terrace, and 0.15 mm/a for the past 14 ka.
Data Availability Statement
The original contributions presented in the study are included in the article/Supplementary Material, further inquiries can be directed to the corresponding author.
Author Contributions
Z-JC, G-NL, and J-FZ contributed to the conception and design of the study. Y-SH carried out the OSL dating. Y-SH and J-FZ organized the data and wrote the first draft of the manuscript. All authors took part in the field work and contributed to manuscript revision, read, and approved the submitted version.
Funding
The work was supported by the National Natural Science Foundation of China (Nos.:41230743 and 42071003).
Conflict of Interest
The authors declare that the research was conducted in the absence of any commercial or financial relationships that could be construed as a potential conflict of interest.
Publisher’s Note
All claims expressed in this article are solely those of the authors and do not necessarily represent those of their affiliated organizations, or those of the publisher, the editors and the reviewers. Any product that may be evaluated in this article, or claim that may be made by its manufacturer, is not guaranteed or endorsed by the publisher.
Acknowledgments
We thank Professors Wei Zhang, Jie Wang and Jingdong Zhao and all other participants for their help in field work and OSL sampling. We appreciate the comments made by Dr. YI and Dr. XM.
Supplementary Material
The Supplementary Material for this article can be found online at: https://www.frontiersin.org/articles/10.3389/feart.2022.939539/full#supplementary-material
References
Alexanderson, H. (2007). Residual OSL Signals from Modern Greenlandic River Sediments. Geochronometria 26, 1–9. doi:10.2478/v10003-007-0001-6
Arne, D., Worley, B., Wilson, C., Chen, S. F., Foster, D., Luo, Z. L., et al. (1997). Differential Exhumation in Response to Episodic Thrusting Along the Eastern Margin of the Tibetan Plateau. Tectonophysics 280, 239–256. doi:10.1016/s0040-1951(97)00040-1
Arnold, L. J., Roberts, R. G., Galbraith, R. F., and DeLong, S. B. (2009). A Revised Burial Dose Estimation Procedure for Optical Dating of Youngand Modern-Age Sediments. Quat. Geochronol. 4, 306–325. doi:10.1016/j.quageo.2009.02.017
Bøtter-Jensen, L., Mejdahl, V., and Murray, A. S. (1999). New Light on OSL. Quat. Sci. Rev. 18, 303–309. doi:10.1016/S0277-3791(98)00063-8
Brennan, B. J., Lyons, R. G., and Phillips, S. W. (1991). Attenuation of Alpha Particle Track Dose for Spherical Grains. Int. J. Radiat. Appl. Instrum. Part D. Nucl. Tracks Radiat. Meas. 18, 249–253. doi:10.1016/1359-0189(91)90119-3
Bull, W. B. (2007). Tectonic Geomorphology of Mountains: A New Approach to Paleoseismology. Oxford: Wiley-Blackwell, 45.
Burchfiel, B. C., Zhiliang, C., Yupinc, L., and Royden, L. H. (1995). Tectonics of the Longmen Shan and Adjacent Regions, Central China. Int. Geol. Rev. 37, 661–735. doi:10.1080/00206819509465424
Chamberlain, E. L., and Wallinga, J. (2019). Seeking Enlightenment of Fluvial Sediment Pathways by Optically Stimulated Luminescence Signal Bleaching of River Sediments and Deltaic Deposits. Earth Surf. Dynam. 7, 723–736. doi:10.5194/esurf-7-723-2019
Chen, S. F., Wilson, C. J. L., Deng, Q. D., Zhao, X. L., and Zhi, L. L. (1994). Active Faulting and Block Movement Associated with Large Earthquakes in the Min Shan and Longmen Mountains, Northeastern Tibetan Plateau. J. Geophys. Res. 99, 24025–24038. doi:10.1029/94jb02132
Chigira, M., Wu, X., Inokuchi, T., and Wang, G. (2010). Landslides Induced by the 2008 Wenchuan Earthquake, Sichuan, China. Geomorphology 118, 225–238. doi:10.1016/j.geomorph.2010.01.003
Clark, K. M., and Royden, H. L. (2000). Topographic Ooze: Building the Eastern Margin of Tibet by Lower Crustal Flow. Geology 28, 703–706. doi:10.1130/0091-7613(2000)028<0703:tobtem>2.3.co;2
Cunha, P. P., Martins, A. A., Huot, S., Murray, A., and Raposo, L. (2008). Dating the Tejo River Lower Terraces in the Ródão Area (Portugal) to Assess the Role of Tectonics and Uplift. Geomorphology 102, 43–54. doi:10.1016/j.geomorph.2007.05.019
Cunningham, A., Wallinga, J., and Minderhoud, P. (2011). Expectations of Scatter in Equivalent-Dose Distributions When Using Multi-Grain Aliquots for OSL Dating. Geochronometria 38, 424–431. doi:10.2478/s13386-011-0048-z
Duller, G. A. T. (2007). Assessing the Error on Equivalent Dose Estimates Derived from Single Aliquot Regenerative Dose Measurements. Anc. TL 25, 15–24.
Duller, G. A. T. (2003). Distinguishing Quartz and Feldspar in Single Grain Luminescence Measurements. Radiat. Meas. 37, 161–165. doi:10.1016/s1350-4487(02)00170-1
Duller, G. A. T. (1994). Luminescence Dating of Poorly Bleached Sediments from Scotland. Quat. Sci. Rev. 13, 521–524. doi:10.1016/0277-3791(94)90070-1
Duller, G. A. T. (2008). Single-Grain Optical Dating of Quaternary Sediments: Why Aliquot Size Matters in Luminescence Dating. Boreas 37, 589–612. doi:10.1111/j.1502-3885.2008.00051.x
Durcan, J. A., King, G. E., and Duller, G. A. T. (2015). DRAC: Dose Rate and Age Calculator for Trapped Charge Dating. Quat. Geochronol. 28, 54–61. doi:10.1016/j.quageo.2015.03.012
Fu, X., Li, S. H., Li, B., and Fu, B. H. (2016). A Fluvial Terrace Record of Late Quaternary Folding Rate of the Anjihai Anticline in the Northern Piedmont of Tian Shan, China. Geomorphology 278, 91–104. doi:10.1016/j.geomorph.2016.10.034
Fu, X., Romanyukha, A. A., Li, B., Jankowski, N. R., Lachlan, T. J., Jacobs, Z., et al. (2022). Beta Dose Heterogeneity in Sediment Samples Measured Using a Timepix Pixelated Detector and its Implications for Optical Dating of Individual Mineral Grains. Quat. Geochronol. 68, 101254. doi:10.1016/j.quageo.2022.101254
Galbraith, R. F., Roberts, R. G., Laslett, G. M., Yoshida, H., and Olley, J. M. (1999). Optical Dating of Single and Multiple Grains of Quartz from Jinmium Rock Shelter, Northern Australia: Part I, Experimental Design and Statistical Models. Archaeometry 41, 339–364. doi:10.1111/j.1475-4754.1999.tb00987.x
Galbraith, R. F., and Roberts, R. G. (2012). Statistical Aspects of Equivalent Dose and Error Calculation and Display in OSL Dating: An Overview and Some Recommendations. Quat. Geochronol. 11, 1–27. doi:10.1016/j.quageo.2012.04.020
Gao, X. Y., and Li, Y. (2006). Comparison on the Incision Rate in the Upper and Middle Reaches of Minjiang River. Resour. Environ. Yangtze Basin 15, 517–521. (In Chinese with English Abstract).
Gong, Z., Li, S.-H., and Li, B. (2014). The Evolution of a Terrace Sequence Along the Manas River in the Northern Foreland Basin of Tian Shan, China, as Inferred from Optical Dating. Geomorphology 213, 201–212. doi:10.1016/j.geomorph.2014.01.009
Gorum, T., Fan, X., van Westen, C. J., Huang, R., Xu, Q., Tang, C., et al. (2011). Distribution Pattern of Earthquake-Induced Landslides Triggered by the 12 May 2008 Wenchuan Earthquake. Geomorphology 133, 152. doi:10.1016/j.geomorph.2010.12.030
Guerin, G., Mercier, N., and Adamiec, G. (2011). Dose-Rate Conversion Factors: Update. Anc. TL 29, 5–8.
Guérin, G., Mercier, N., Nathan, R., Adamiec, G., and Lefrais, Y. (2012). On the Use of the Infinite Matrix Assumption and Associated Concepts: A Critical Reviewfinite Matrix Assumption and Associated Concepts: A Critical Review. Radiat. Meas. 47, 778–785. doi:10.1016/j.radmeas.2012.04.004
Guo, Y.-J., Zhang, J.-F., Qiu, W.-L., Hu, G., Zhuang, M.-G., and Zhou, L.-P. (2012). Luminescence Dating of the Yellow River Terraces in the Hukou Area, China. Quat. Geochronol. 10, 129–135. doi:10.1016/j.quageo.2012.03.002
Harrison, T. M., Copeland, P., Kidd, W. S. F., and Yin, A. (1992). Raising Tibet. Science 255, 1663–1670. doi:10.1126/science.255.5052.1663
Hetzel, R. (2013). Active Faulting, Mountain Growth, and Erosion at the Margins of the Tibetan Plateau Constrained by In Situ-Produced Cosmogenic Nuclides. Tectonophysics 582, 1–24. doi:10.1016/j.tecto.2012.10.027
Hu, G., Yi, C.-L., Zhang, J.-F., Liu, J.-H., and Jiang, T. (2015). Luminescence Dating of Glacial Deposits Near the Eastern Himalayan Syntaxis Using Different Grain-Size Fractions. Quat. Sci. Rev. 124, 124–144. doi:10.1016/j.quascirev.2015.07.018
Hu, G., Zhang, J.-F., Qiu, W.-L., and Zhou, L.-P. (2010). Residual OSL Signals in Modern Fluvial Sediments from the Yellow River (HuangHe) and the Implications for Dating Young Sediments. Quat. Geochronol. 5, 187–193. doi:10.1016/j.quageo.2009.05.003
Hubbard, J., and Shaw, J. H. (2009). Uplift of the Longmen Shan and Tibetan Plateau, and the 2008 Wenchuan (M = 7.9) Earthquake. Nature 458, 194–197. doi:10.1038/nature07837
Jain, M., Murray, A. S., and Botter-Jensen, L. (2004). Optically Stimulated Luminescence Dating: How Significant Is Incomplete Light Exposure in Fluvial Environments? Quaternaire 15, 143–157. doi:10.3406/quate.2004.1762
Jankowski, N. R., and Jacobs, Z. (2018). Beta Dose Variability and its Spatial Contextualisation in Samples Used for Optical Dating: An Empirical Approach to Examining Beta Microdosimetry. Quat. Geochronol. 44, 23–37. doi:10.1016/j.quageo.2017.08.005
Kirby, E., Reiners, P. W., Krol, M. A., Whipple, K. X., Hodges, K. V., Farley, K. A., et al. (2002). Late Cenozoic Evolution of the Eastern Margin of the Tibetan Plateau: Inferences from 40Ar/39Ar and (U-Th)/He Thermochronology. Tectonics 21, 1. doi:10.1029/2000tc001246
Kirby, E., Whipple, K. X., Burchfiel, B. C., Tang, W., Berger, G., Sun, Z., et al. (2000). Neotectonics of the Min Shan, China: Implications for Mechanisms Driving Quaternary Deformation Aong the Eastern Margin of the Tibetan Plateau. Geol. Soc. Am. Bull. 112, 375–393. doi:10.1130/0016-7606(2000)112<375:notmsc>2.0.co;2
Kreutzer, S., Schmidt, C., Fuchs, M. C., Dietze, M., Fischer, M., and Fuchs, M. (2012). Introducing an R Package for Luminescence Dating Analysis. Anc. TL 30, 1–8.
Lavé, J., and Avouac, J. P. (2001). Fluvial Incision and Tectonic Uplift Across the Himalaya of Central Nepal. J. Geophys. Res. 106, 26561–26591. doi:10.1029/2001JB000359
Lepper, K., and McKeever, S. W. S. (2002). An Objective Methodology for Dose Distribution Analysis. Radiat. Prot. Dosim. 101, 349–352. doi:10.1093/oxfordjournals.rpd.a005999
Li, J. J., Fang, X. M., Pan, B. T., Zhao, Z. J., and Song, Y. G. (2001). Late Cenozoic Intensive Uplift of Qinghai-Xizang Plateau and its Impacts on Environments in Surrounding Area. Quat. Sci. 21, 381–391. (In Chinese with English Abstract).
Li, J. J. (1991). The Environmental Effects of the Uplift of the Qinghai-Xizang Plateau. Quat. Sci. Rev. 10, 479–483. doi:10.1016/0277-3791(91)90041-r
Li, Y., Cao, S. Y., Zhou, R. J., Densmore, A. L., and Ellis, M. A. (2005). Late Cenozoic Minjiang Incision Rate and its Constraint on the Uplift of the Eastern Margin of the Tibetan Plateau. Acta Geol. Sin. 79, 28–37. (In Chinese with English Abstract).
Liang, P., and Forman, S. L. (2019). LDAC: An Excel-Based Program for Luminescence Equivalent Dose and Burial Age Calculations. Anc. TL 37, 21e40.
Lisiecki, L. E., and Raymo, M. E. (2005). A Pliocene–Pleistocene Stack of 57 Globally Distributed Benthic δ18O Records. Paleoceanography 20, PA1003. doi:10.1029/2004pa001071
Liu, B., Cui, Z., Peng, X., Han, Y., and Liu, G. (2018). Using 10Be Exposure Dating to Constrain Glacial Advances During the Late Glacial and Holocene on Mount Xuebaoding, Eastern Tibetan Plateau. Quat. Res. 90, 348–359. doi:10.1017/qua.2018.33
Liu, C.-R., Yin, G.-M., Zhang, H.-P., Zheng, W.-J., Voinchet, P., Han, F., et al. (2013). ESR Geochronology of the Minjiang River Terraces at Wenchuan, Eastern Margin of Tibetan Plateau, China. Geochronometria 40, 360–367. doi:10.2478/s13386-013-0129-2
Luo, X., Ying, Z., and Yang, L. (2019). Preliminary Analysis on the Development Characteristics of River Terraces and Their Relationship with Ancient Landslides in the Upper Reaches of Minjinag River. Quarter. Sci. 39, 391–398. (Chinese with English abstract).
Ma, B. Q., Su, G., Hou, Z. H., and Shu, S. B. (2005). Late Quaternary Slip Rate in the Central Part of the Longmenshan Fault Zone from Terrace Deformation Along the Minjiang River. Seismol. Geol. 27, 234–242. (In Chinese with English Abstract).
Maddy, D., Bridgland, D. R., and Green, C. P. (2000). Crustal Uplift in Southern England: Evidence from the River Terrace Records. Geomorphology 33, 167–181. doi:10.1016/s0169-555x(99)00120-8
Maddy, D. (1997). Uplift-Driven Valley Incision and River Terrace Formation in Southern England. J. Quat. Sci. 12, 539–545. doi:10.1002/(sici)1099-1417(199711/12)12:6<539:aid-jqs350>3.0.co;2-t
Merritts, D. J., Vincent, K. R., and Wohl, E. E. (1994). Long River Profiles, Tectonism, and Eustasy: A Guide to Interpreting Fluvial Terraces. J. Geophys. Res. 99, 14031–14050. doi:10.1029/94jb00857
Murray, A., Arnold, L. J., Buylaert, J. P., Guérin, G., Qin, J., Singhvi, A. K., et al. (2021). Optically Stimulated Luminescence Dating Using Quartz. Nat. Rev. Methods Prim. 1, 1–31. doi:10.1038/s43586-021-00068-5
Murray, A. S., Olley, J. M., and Caitcheon, G. G. (1995). Measurement of Equivalent Doses in Quartz from Contemporary Water-Lain Sediments Using Optically Stimulated Luminescence. Quat. Sci. Rev. 14, 365–371. doi:10.1016/0277-3791(95)00030-5
Murray, A. S., and Wintle, A. G. (2000). Luminescence Dating of Quartz Using an Improved Single-Aliquot Regenerative-Dose Protocol. Radiat. Meas. 32, 57–73. doi:10.1016/s1350-4487(99)00253-x
Murray, A. S., and Wintle, A. G. (2003). The Single Aliquot Regenerative Dose Protocol: Potential for Improvements in Reliability. Radiat. Meas. 37, 377–381. doi:10.1016/s1350-4487(03)00053-2
Olley, J., Caitcheon, G., and Murray, A. (1998). The Distribution of Apparent Dose as Determined by Optically Stimulated Luminescence in Small Aliquots of Fluvial Quartz: Implications for Dating Young Sediments. Quat. Sci. Rev. 17, 1033–1040. doi:10.1016/s0277-3791(97)00090-5
Olley, J. M., Caitcheon, G. G., and Roberts, R. G. (1999). The Origin of Dose Distributions in Fluvial Sediments, and the Prospect of Dating Single Grains from Fluvial Deposits Using Optically Stimulated Luminescencefluvial Sediments, and the Prospect of Dating Single Grains from Fluvial Deposits Using Optically Stimulated Luminescence. Radiat. Meas. 30, 207–217. doi:10.1016/s1350-4487(99)00040-2
Pan, B., Su, H., Hu, Z., Hu, X., Gao, H., Li, J., et al. (2009). Evaluating the Role of Climate and Tectonics During Non-Steady Incision of the Yellow River: Evidence from a 1.24 Ma Terrace Record Near Lanzhou, China. Quat. Sci. Rev. 28, 3281–3290. doi:10.1016/j.quascirev.2009.09.003
Perkins, N. K., and Rhodes, E. J. (1994). Optical Dating of Fluvial Sediments from Tattershall, U.K. Quat. Sci. Rev. 13, 517–520. doi:10.1016/0277-3791(94)90069-8
Rhodes, E. J. (2011). Optically Stimulated Luminescence Dating of Sediments Over the Past 200,000 Years. Annu. Rev. Earth Planet. Sci. 39, 461–488. doi:10.1146/annurev-earth-040610-133425
Rittenour, T. M. (2008). Luminescence Dating of Fluvial Deposits: Applications to Geomorphic, Palaeoseismic and Archaeological Research. Boreas 37, 613–635. doi:10.1111/j.1502-3885.2008.00056.x
Rodnight, H., Duller, G. A. T., Wintle, A. G., and Tooth, S. (2006). Assessing the Reproducibility and Accuracy of Optical Dating of Fluvial Deposits. Quat. Geochronol. 1, 109–120. doi:10.1016/j.quageo.2006.05.017
Royden, L. H., Burchfiel, B. C., and Van Der Hilst, R. D. (2008). The Geological Evolution of the Tibetan Plateau. Science 321, 1054–1058. doi:10.1126/science.1155371
Ruszkiczay-Rüdiger, Z., Fodor, L., Bada, G., Leél-Össy, S., Horváth, E., and Dunai, T. J. (2005). Quantification of Quaternary Vertical Movements in the Central Pannonian Basin: A Review of Chronologic Data Along the Danube River, Hungary. Tectonophysics 410, 157–172. doi:10.1016/j.tecto.2005.05.048
Singh, A., Thomsen, K. J., Sinha, R., Buylaert, J. P., Carter, A., Mark, D. F., et al. (2017). Counter-Intuitive Influence of Himalayan River Morphodynamics on Indus Civilisation Urban Settlementsfluence of Himalayan River Morphodynamics on Indus Civilisation Urban Settlements. Nat. Commun. 8, 1617. doi:10.1038/s41467-017-01643-9
Spencer, J. Q., Sanderson, D. C. W., Deckers, K., and Sommerville, A. A. (2003). Assessing Mixed Dose Distributions in Young Sediments Identified Using Small Aliquots and a Simple Two-Step SAR Procedure: The F-Statistic as a Diagnostic Tool. Radiat. Meas. 37, 425–431. doi:10.1016/s1350-4487(03)00064-7
Spooner, N. A. (1994). The Anomalous Fading of Infrared-Stimulated Luminescence from Feldspars. Radiat. Meas. 23, 625–632. doi:10.1016/1350-4487(94)90111-2
Tan, X., Liu, Y., Lee, Y.-H., Lu, R., Xu, X., Suppe, J., et al. (2019). Parallelism Between the Maximum Exhumation Belt and the Moho Ramp Along the Eastern Tibetan Plateau Margin: Coincidence or Consequence? Earth Planet. Sci. Lett. 507, 73–84. doi:10.1016/j.epsl.2018.12.001
Tang, R. C., Wen, D. H., Huang, Z. Z., Wu, X. G., Lin, W. F., Chen, G. X., et al. (1991). The Quaternary Activity Characteristics of Several Major Active Faults in the Songpan-Longmenshan Region. Earthq. Res. China 7, 64–71. (in Chinese with English abstract).
Thomsen, K. J., Murray, A. S., Buylaert, J. P., Jain, M., Hansen, J. H., and Aubry, T. (2016). Testing Single-Grain Quartz OSL Methods Using Sediment Samples with Independent Age Control from the Bordes-Fitte Rockshelter (Roches d'Abilly Site, Central France). Quat. Geochronol. 31, 77–96. doi:10.1016/j.quageo.2015.11.002
Toda, S., Lin, J., Meghraoui, M., and Stein, R. S. (2008). 12 May 2008 M = 7.9 Wenchuan, China, Earthquake Calculated to Increase Failure Stress and Seismicity Rate on Three Major Fault Systems. Geophys. Res. Lett. 35, L17305. doi:10.1029/2008gl034903
Tóth, O., Sipos, G., Kiss, T., and Bartyik, T. (2017). Variation of OSL Residual Doses in Terms of Coarse and Fine Grain Modern Sediments Along the Hungarian Section of the Danube. Geochronometria 44, 319–330. doi:10.1515/geochr-2015-0079
Vance, D., Bickle, M., Ivy-Ochs, S., and Kubik, P. W. (2003). Erosion and Exhumation in the Himalaya from Cosmogenic Isotope Inventories of River Sediments. Earth Planet. Sci. Lett. 206, 273–288. doi:10.1016/s0012-821x(02)01102-0
Vandenberghe, J. (1995). Timescales, Climate and River Development. Quat. Sci. Rev. 14, 631–638. doi:10.1016/0277-3791(95)00043-o
Wallinga, J. (2002). Optically Stimulated Luminescence Dating of Fluvial Deposits: A Review. Boreas 31, 303–322. doi:10.1080/030094802320942536
Wang, E., and Meng, Q. (2009). Mesozoic and Cenozoic Tectonic Evolution of the Longmenshan Fault Belt. Sci. China Ser. D-Earth Sci. 52, 579–592. doi:10.1007/s11430-009-0053-8
Wang, L. S., Wang, X. Q., Xu, X. N., Cui, J., Sheng, J. H., and Zhang, Z. L. (2012). Significances of Studying the Diexi Paleo-Dammed Lake at the Upstream of Minjiang River, Sichuan, China. Quat. Sci. 32, 998–1010. (In Chinese with English Abstract).
Wang, P., Zhang, B., Qiu, W., and Wang, J. (2011). Soft-Sediment Deformation Structures from the Diexi Paleo-Dammed Lakes in the Upper Reaches of the Minjiang River, East Tibet. J. Asian Earth Sci. 40, 865–872. doi:10.1016/j.jseaes.2010.04.006
Wintle, A. G., and Murray, A. S. (2006). A Review of Quartz Optically Stimulated Luminescence Characteristics and Their Relevance in Single-Aliquot Regeneration Dating Protocols. Radiat. Meas. 41, 369–391. doi:10.1016/j.radmeas.2005.11.001
Wu, L. Z., Zhao, D. J., Zhu, J. D., Peng, J. B., and Zhou, Y. (2020). A Late Pleistocene River-Damming Landslide, Minjiang River, China. Landslides 17, 433–444. doi:10.1007/s10346-019-01305-5
Wu, X. P., and Hu, J. Z. (2009). Features of Neotectonic Movement in the Source Area of the Minjiang River. Geoscience 23, 430–439. (In Chinese with English).
Yan, Y.-Y., Zhang, J.-F., Hu, G., and Zhou, L.-P. (2021). Luminescence Chronology of the Yellow River Terraces in the Heiyukou Area, China, and its Implication for the Uplift Rate of the Ordos Plateau. Geochronometria 48, 325–338. doi:10.2478/geochr-2020-0008
Yan, Y. Y., Zhang, J. F., Hu, G., and Zhou, L. P. (2018). Comparison of Various Luminescence Dating Procedures on Sediments from One of the Strath Terraces of the Yellow River in the Jinshaan Canyon. Quat. Sci. 38, 594–610. (in Chinese with English abstract).
Yang, N., Zhang, Y. Q., Meng, H., and Zhang, H. P. (2003). Study of the Minjiang River Terraces in the Western Sichuan Plateau. J. Geomechanics 9, 363–370. (In Chinese with English Abstract).
Zhang, H.-P., Liu, S.-F., Yang, N., Zhang, Y.-Q., and Zhang, G.-W. (2006a). Geomorphic Characteristics of the Minjiang Drainage Basin (Eastern Tibetan Plateau) and its Tectonic Implications: New Insights from a Digital Elevation Model Study. Isl. Arc. 15, 239–250. doi:10.1111/j.1440-1738.2006.00524.x
Zhang, H. P., Yang, N., Zhang, Y. Q., and Meng, H. (2006b). Geomorphology of the Minjiang Drainage System (Sichuan, China) and its Structural Implications. Quat. Sci. 26, 126–135. (In Chinese with English Abstract).
Zhang, J.-F., Qiu, W.-L., Hu, G., and Zhou, L.-P. (2020). Determining the Age of Terrace Formation Using Luminescence Dating-A Case of the Yellow River Terraces in the Baode Area, China. MPs 3, 17. doi:10.3390/mps3010017
Zhang, J.-F., Qiu, W.-L., Li, R.-Q., and Zhou, L.-P. (2009). The Evolution of a Terrace Sequence Along the Yellow River (Huang He) in Hequ, Shanxi, China, as Inferred from Optical Dating. Geomorphology 109, 54–65. doi:10.1016/j.geomorph.2008.08.024
Zhang, J. F., Zhou, L. P., and Yue, S. Y. (2003). Dating Fluvial Sediments by Optically Stimulated Luminescence: Selection of Equivalent Doses for Age Calculationfluvial Sediments by Optically Stimulated Luminescence: Selection of Equivalent Doses for Age Calculation. Quat. Sci. Rev. 22, 1123–1129. doi:10.1016/s0277-3791(03)00054-4
Zhao, S., Chigira, M., and Wu, X. (2019). Gigantic Rockslides Induced by Fluvial Incision in the Diexi Area Along the Eastern Margin of the Tibetan Plateau. Geomorphology 338, 27–42. doi:10.1016/j.geomorph.2019.04.008
Zhao, X. L., Deng, Q. D., and Chen, S. F. (1994). Tectonic Geomorphology of the Minshan Uplift in the Western Sichuan, Southwestern China. Seismol. Geol. 16, 429–439. (In Chinese with English Abstract).
Keywords: quartz OSL dating, fluvial terraces, incision rate, Minjiang River, Tibetan Plateau
Citation: Han Y-S, Zhang J-F, Liu G-N and Cui Z-J (2022) Optical Dating of Quartz Grains From the Minjiang Fluvial Terraces in the Sonpan Area on the Eastern Margin of the Tibetan Plateau. Front. Earth Sci. 10:939539. doi: 10.3389/feart.2022.939539
Received: 09 May 2022; Accepted: 24 May 2022;
Published: 30 June 2022.
Edited by:
Hao Long, Nanjing Institute of Geography and Limnology (CAS), ChinaReviewed by:
Yuji Ishii, National Institute of Advanced Industrial Science and Technology (AIST), JapanXiaodong Miao, Linyi University, China
Copyright © 2022 Han, Zhang, Liu and Cui. This is an open-access article distributed under the terms of the Creative Commons Attribution License (CC BY). The use, distribution or reproduction in other forums is permitted, provided the original author(s) and the copyright owner(s) are credited and that the original publication in this journal is cited, in accordance with accepted academic practice. No use, distribution or reproduction is permitted which does not comply with these terms.
*Correspondence: Jia-Fu Zhang, jfzhang@pku.edu.cn